This piece is part of Scientific American’s column The Science of Parenting. For more, go here.
As we strive to keep our kids safe, healthy and happy, detecting and treating developmental and other conditions early is essential. For this reason, pediatric care emphasizes the importance of screening for everything from developmental delays to emotional problems to autism. Unfortunately, screening results are not always reassuring. For example, when a screening questionnaire comes back “positive” for, say, autism, panic can set in. What does this result mean, and why does the doctor think your child is autistic?
It turns out these screening results don’t offer simple “yes” or “no” answers as to whether a child has a condition. Identification depends a lot on estimates of how common a condition is. Detecting uncommon conditions, such as autism, is a lot harder than anyone would like. Parents should know this when hearing about their child’s scores. Understanding why requires knowing a few basic facts about the science of screening.
On supporting science journalism
If you’re enjoying this article, consider supporting our award-winning journalism by subscribing. By purchasing a subscription you are helping to ensure the future of impactful stories about the discoveries and ideas shaping our world today.
Simply put, a screening questionnaire is a standardized set of questions designed to identify or predict one or more conditions or potential health or quality of life issues. For example a screener for autism usually includes questions about behaviors that are known to be its early signs, often focusing on how children communicate. Typically each answer is scored—for example, a “yes” response may receive a 1, and a “no” response may receive a 0. Sometimes, particularly for developmental milestones, questions are scored by comparing a child’s results with those of same-aged children. Either way, answers are combined to generate a total score.
Most screening questionnaires also have thresholds, or “cut scores.” Scores above this threshold are said to be positive. Medical professionals are accustomed to this language, but it can be confusing to patients. Positive results most often indicate risk, such as a higher chance of being autistic or having another condition.
How do we know that positive scores indicate a higher probability of a given condition? This is what scientists mean when they describe screeners as “validated.” Ideally studies have been conducted that compare screening scores with the results of a highly accurate independent evaluation. If research demonstrates that the chance of having a condition is higher among children who screen positive than among those who screen negative, then the screening questionnaire is said to have diagnostic accuracy. If it identifies children who will develop a condition in the future, the questionnaire is said to have predictive validity.
It is hoped that a good screening questionnaire or medical test will also help you estimate the probability of having a condition. Let’s take a closer look.
Imagine that hundreds of parents complete a “validated” screening questionnaire designed to detect not just autism but developmental and behavioral issues in general. Let’s say that one in three children have a developmental or behavioral condition that we would like to detect (this is a high estimate but not outside the realm of possibility). The graphic below shows the number of children with and without a condition who receive each possible screening score.
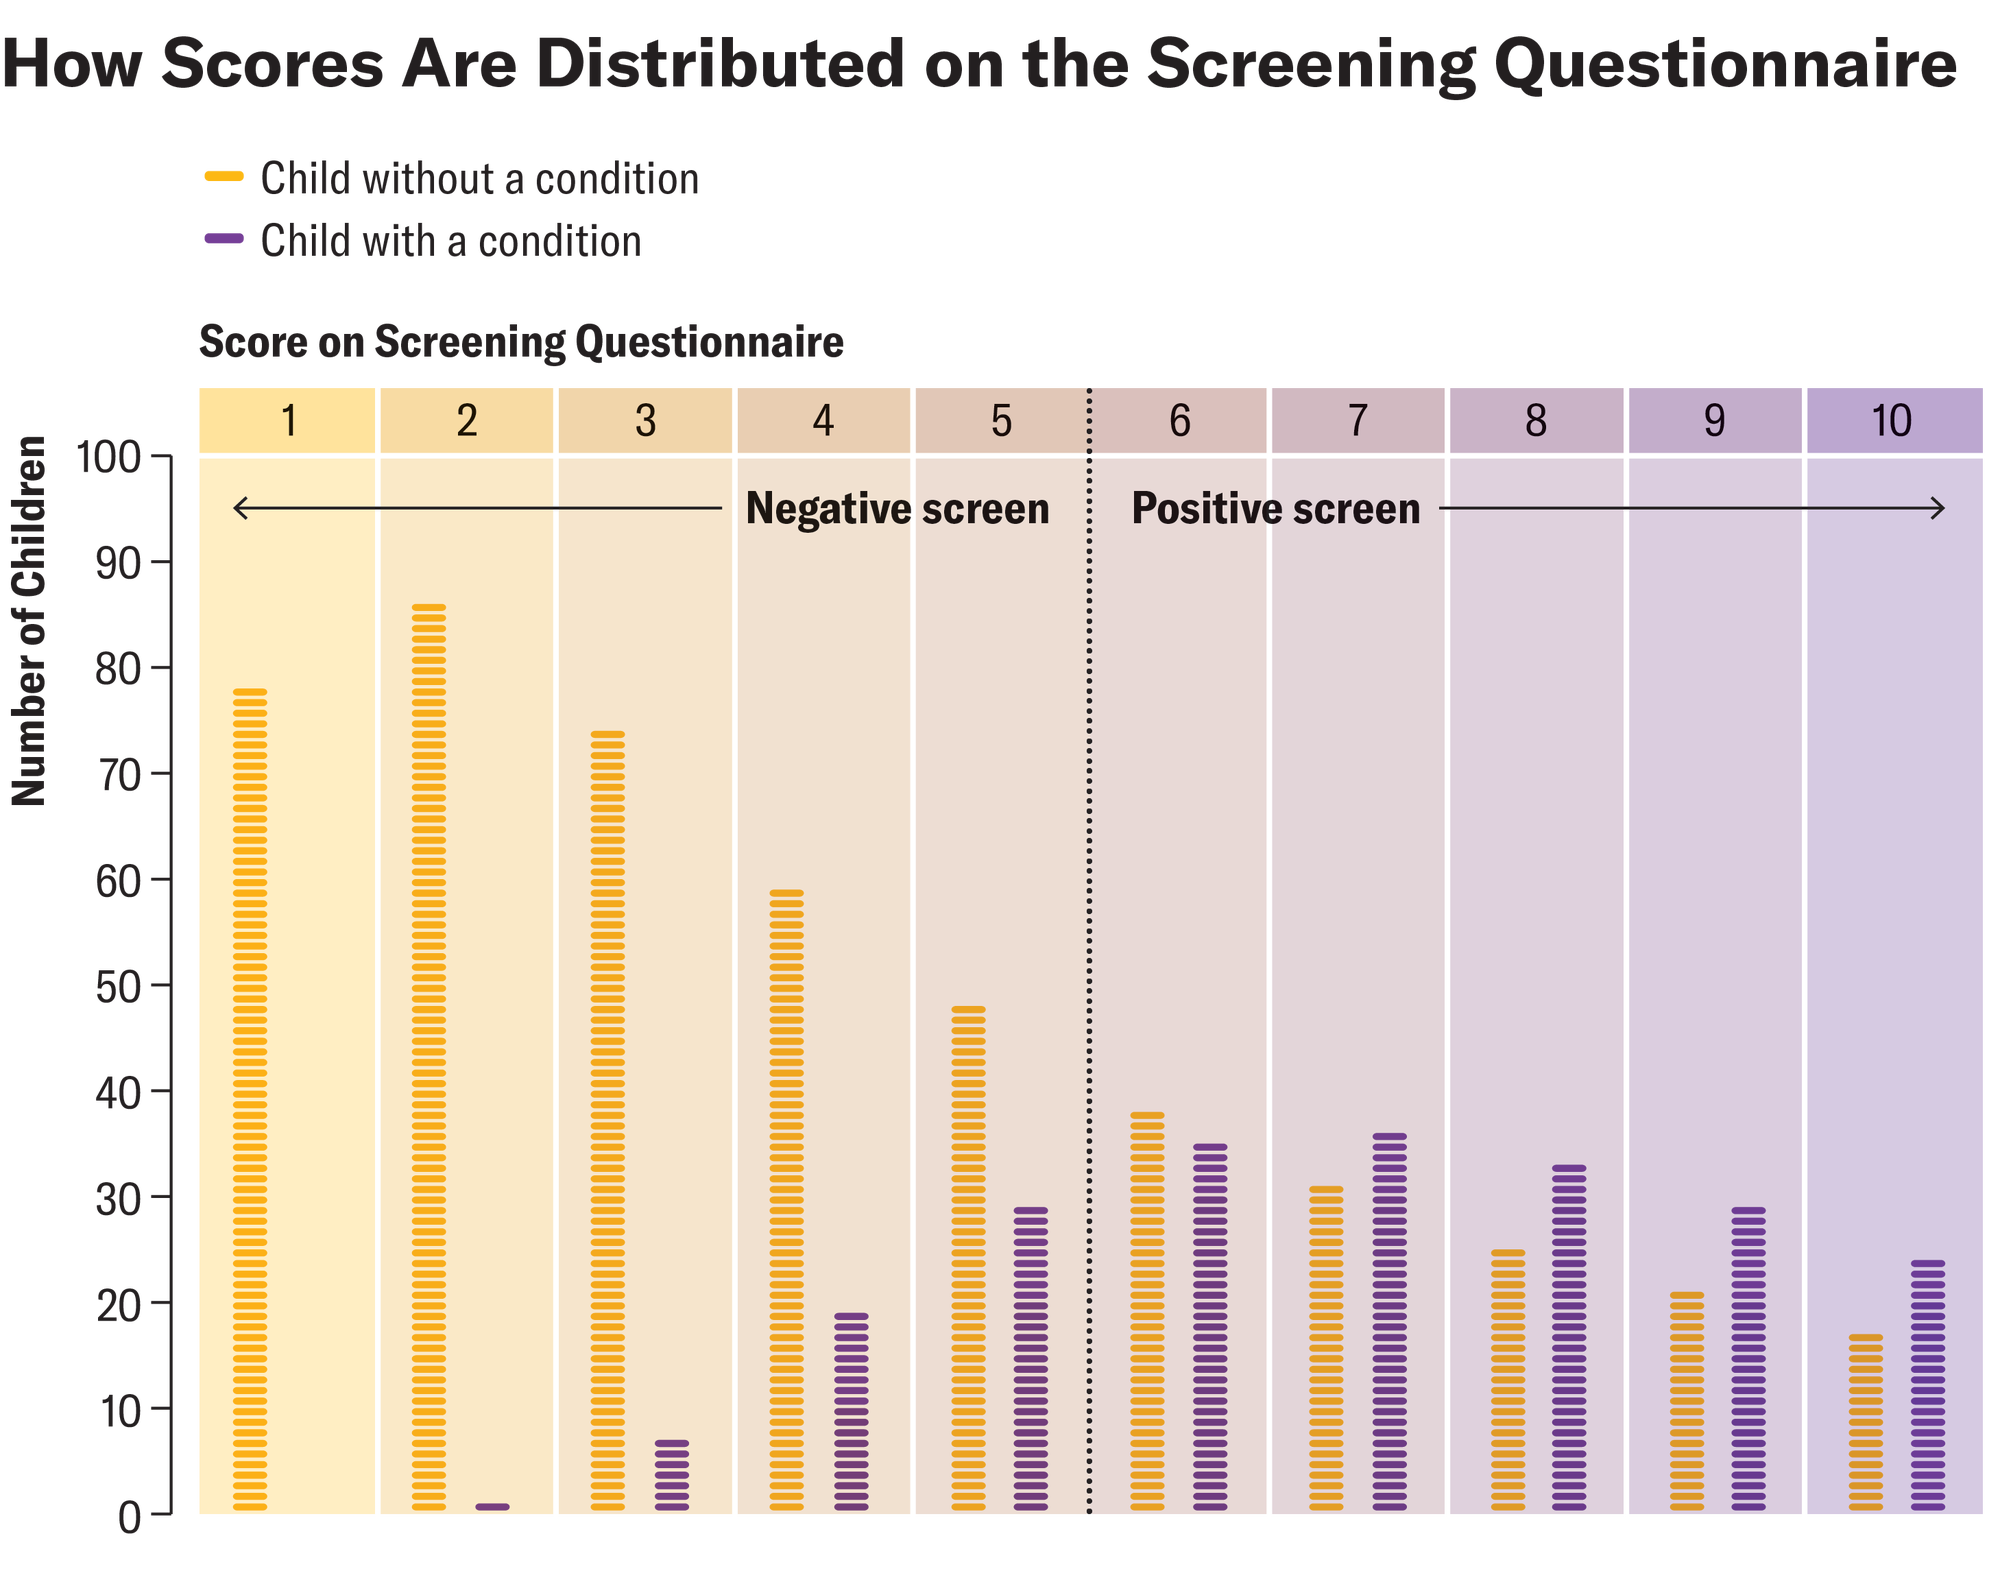
Amanda Montañez; Source: Chris Sheldrick (data)
Of the 289 children who screen positive with a threshold score of 6 and above, 157 have a condition. So we estimate that 54 percent of children who screen positive will have one. Scientists call this positive predictive value, or PPV. That seems simple enough: If a screen is positive, the child has a 54 percent chance of having a condition, right? Not so fast—there are at least four caveats to keep in mind.
First, no matter how much science is behind these questionnaires, there are trade-offs in every screening threshold. On the one hand, with a threshold score of 6 and above, 26 percent of children with a condition screen negative. People who worry about underdetection might want a lower threshold. If the threshold were moved to a score of 4 and above, most of the children with a condition would screen positive. On the other hand, 46 percent of children who screen positive with a threshold score of 6 and above in our example don’t have a condition. People who worry about the strain on families may want a higher threshold, in which case a score of 6 would no longer be positive.
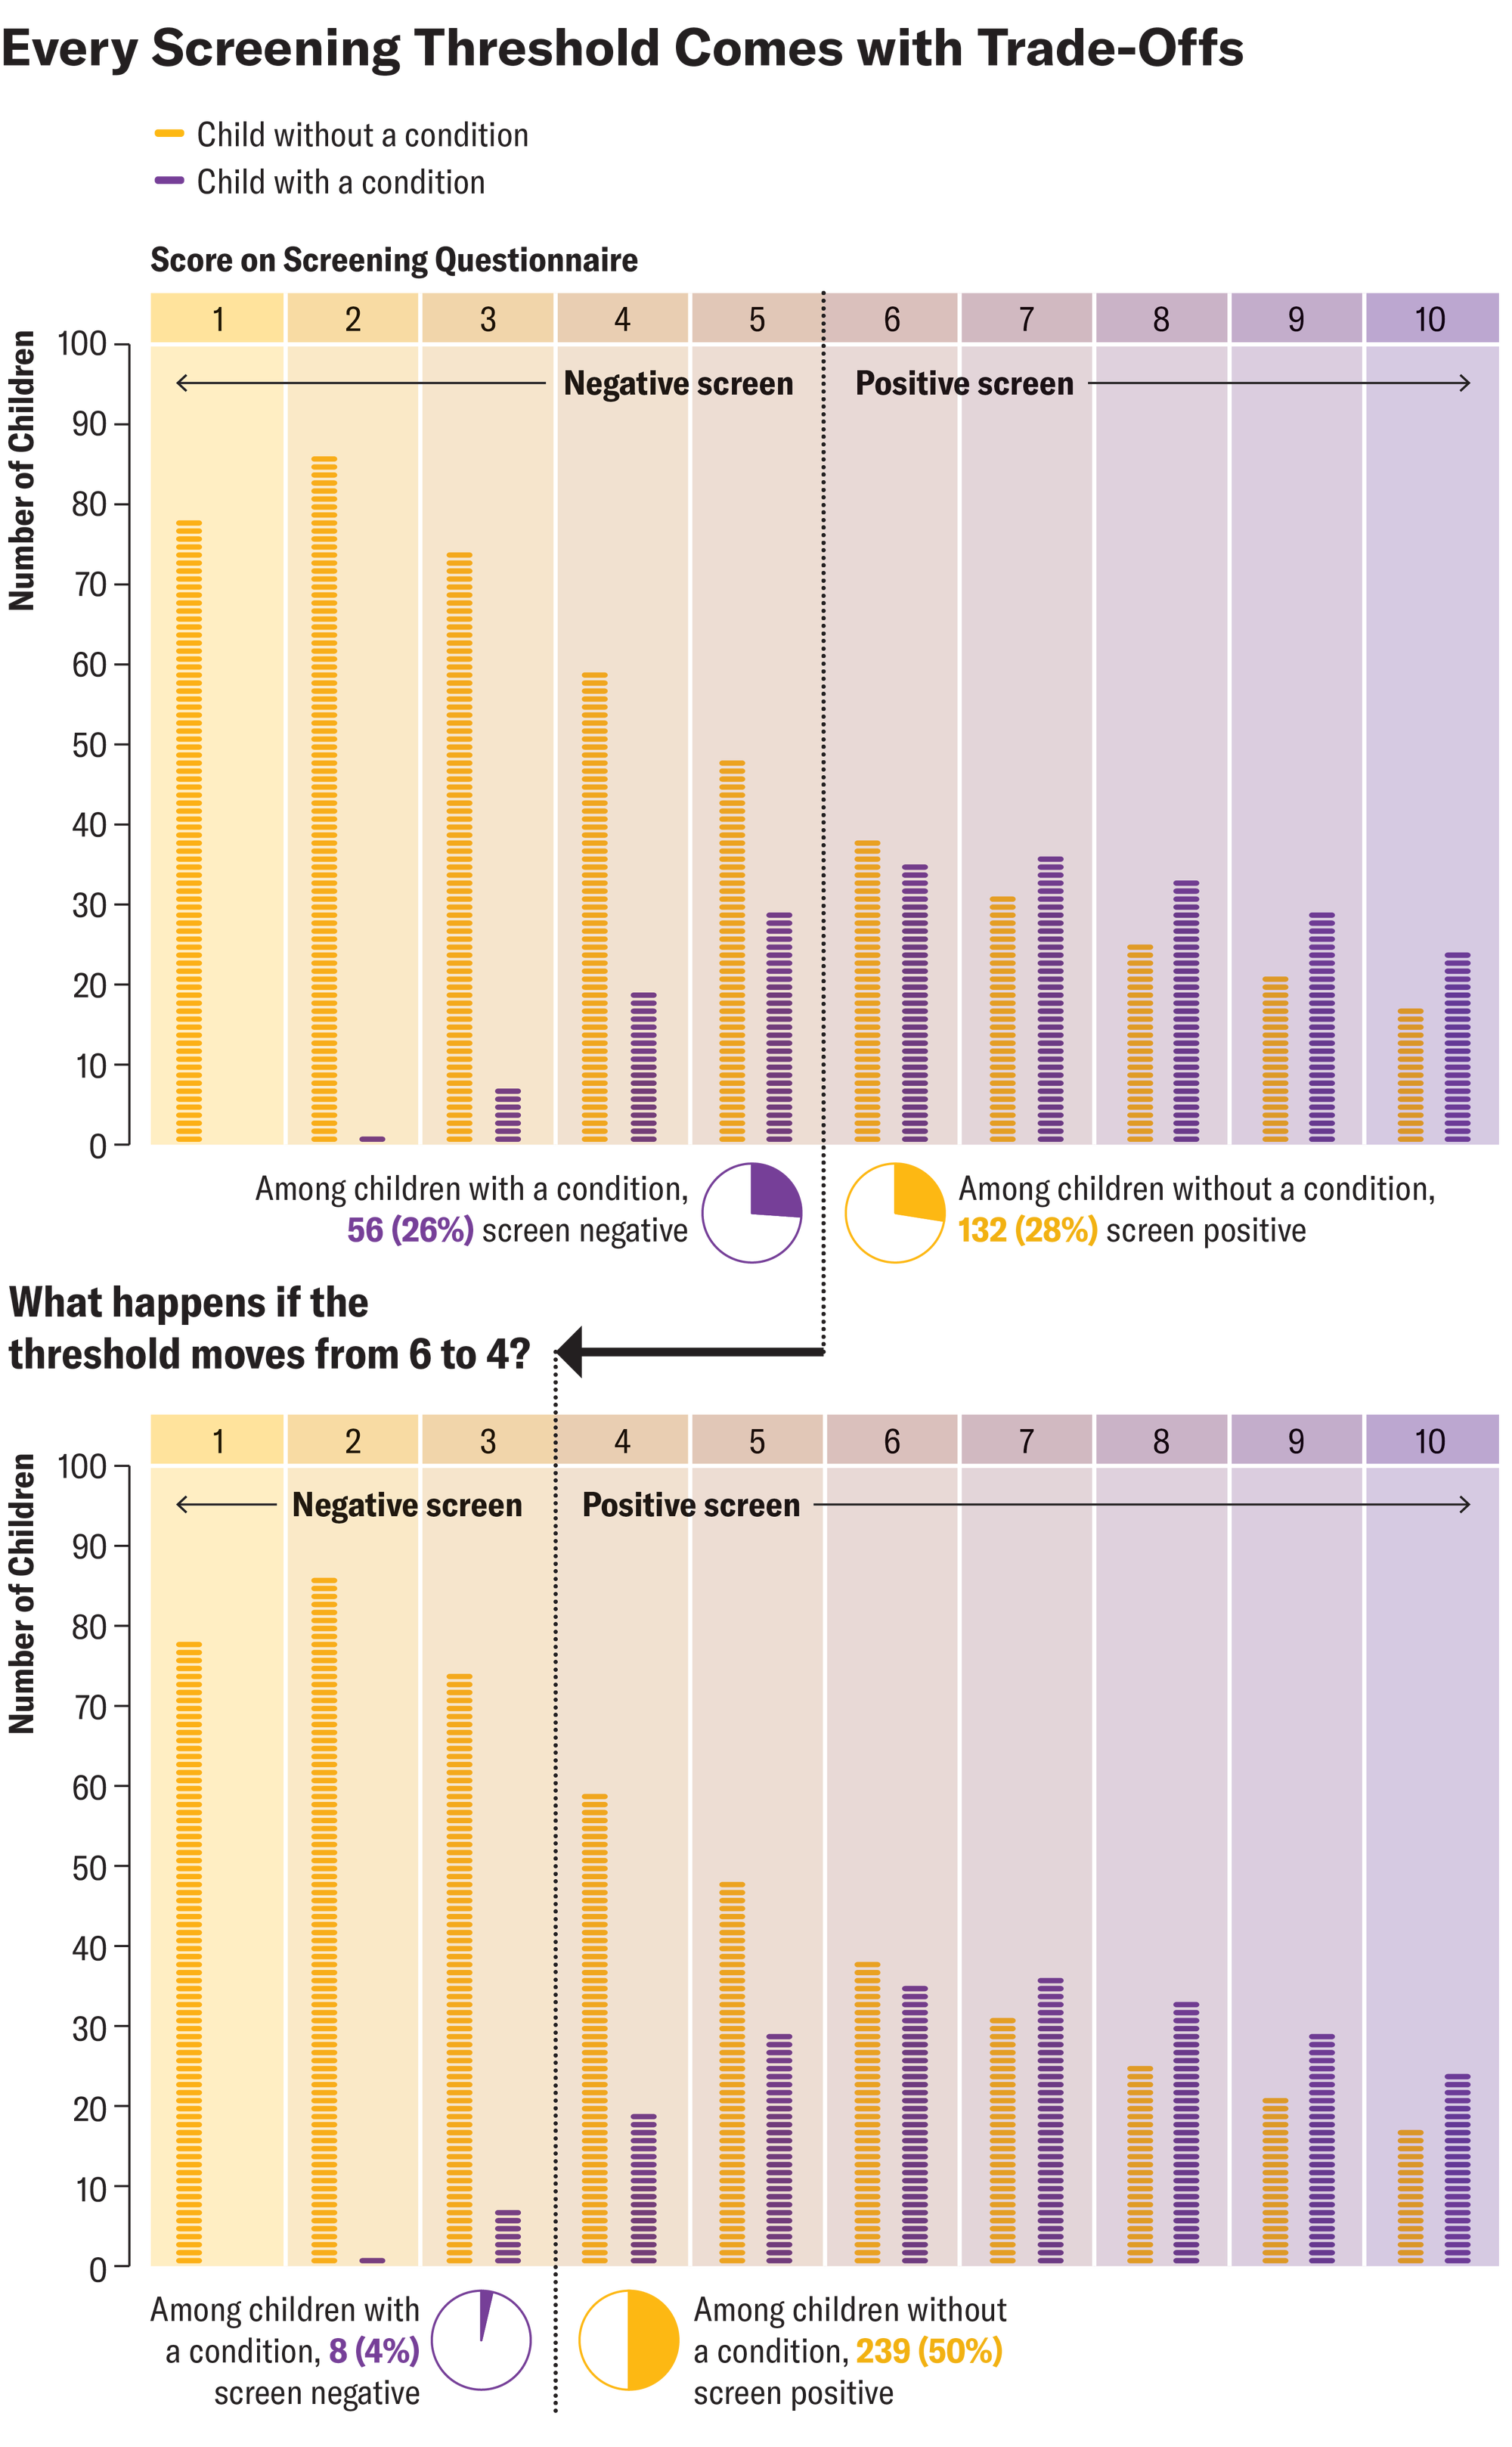
Amanda Montañez; Source: Chris Sheldrick (data)
Second, given trade-offs in screening thresholds, it is also worth considering the screening score itself. In our example a score of 6 and above indicates a positive screening result. Among the 73 children with an exact score of 6, 35 have a condition. That’s 48 percent, which is a lower accuracy than seen in the positive predictive value of 54 percent. This situation is not uncommon. PPV represents an average of all positive screening scores. Thus, PPV tends to overestimate probabilities for screening scores near the threshold and to underestimate probabilities for very high screening scores.

Amanda Montañez; Source: Chris Sheldrick (data)
Third, predictive probabilities are highly affected by prevalence—the proportion of children in the population who have a condition. All of the examples described above refer to the same screener—that is, the same proportion of children with a condition screen positive, and the same proportion of children without one screen negative. Prevalence makes a critical difference, however. When the prevalence of a condition in children is 2.8 percent (the current estimate for autism), and a child has a positive score of 6 or above, the chance that that child has that condition is only about 8 percent.

Amanda Montañez; Source: Chris Sheldrick (data)
One way to understand this is to consider that, when prevalence is low, there are many nonautistic children for every autistic child. Every one of those nonautistic children has some chance—however low—of a “false positive” screening result. When prevalence is low, the number of “false positives” can swamp the number of “true positives,” even for an accurate screening test. Frankly, this blew my mind when I first learned about it, but all such tests are affected by prevalence in this way. Predicting uncommon events is not easy. (For example, with a positive influenza test, your chance of having the illness is lower if it’s not flu season.)
Finally, there’s a reason why I put quotes around “validated.” However much research there is to support a questionnaire, nothing is perfect. Besides, we should always ask questions about how past research applies to future children growing up in different places. “Validated” screeners can be useful and are worthy of our attention—but we should use our judgment, too.
This is an opinion and analysis article, and the views expressed by the author or authors are not necessarily those of Scientific American.
Source link